压测,即压力测试,是指对计算机系统、软件应用或网络服务等进行负载测试,以模拟实际使用场景中的高负载情况,检验系统在压力下的性能、稳定性和可靠性。压测旨在确定系统在正常或极端负载下的性能极限,以便在生产环境中提供最佳的性能和可靠性。
为什么要压测了解ES各版本性能差异:ES版本更新很快,每次版本更新都会带来性能提升,但只有当我们进过性能测试后,才能清楚的知道性能提升幅度,再决定是否需要升级。
针对ES参数做验证测试:我们都知道调整索引分片、副本数、刷新时间等参数可以提高读写性能,但具体需要设置为多少,可以通过压测有更直观的对比。
了解集群性能瓶颈:只有针对ES集群做压测,才能清楚的知道集群读写性能峰值多少,性能瓶颈在磁盘还是网络带宽,通过找出并解决性能瓶颈,可以提高集群的性能和可靠性,提升用户体验。
集群容量规划:压测可以帮助我们规划系统的容量和资源需求,包括服务器配置、网络带宽、存储容量等。通过了解系统在不同负载下的资源消耗情况,可以合理规划资源投入,避免资源不足或浪费。
如何进行压测使用官方工具esrally:elastic官方提供了压测工具,内置多种数据集可模拟各个应用场景下的需求。模拟真实的生产环境中的负载,包括索引、搜索、聚合等操作,以便评估Elasticsearch在不同负载下的性能表现。支持测试不同版本的Elasticsearch,用户可以轻松地比较不同版本之间的性能差异。生成详细的测试报告,包括测试结果、性能指标、图表等,帮助用户全面了解测试的结果。
使用http压测工具:可以通过http协议的压测工具比如JMeter、httpload等,通过请求es的RestfulAPI接口进行性能测试。
开发程序使用客户端请求测试:es支持多个语言的sdk包,可以针对特定使用场景开发程序进行性能测试。
esrally简介esrally优点模拟真实场景:Rally可以模拟真实的生产环境中的负载,包括索引、搜索、聚合等操作,以便评估Elasticsearch在不同负载下的性能表现。
多种负载类型:Rally提供了多种预置的负载类型,如Index、Search、Bulk、Update等,用户可以根据需求选择合适的负载类型进行测试。
灵活的配置:Rally允许用户对测试进行灵活的配置,包括索引设置、数据量、并发度等参数。用户可以根据自己的需求定制测试方案。
自动化测试:Rally支持自动化测试流程,可以通过简单的命令行操作启动测试,并自动收集性能数据、生成报告等。
多版本支持:Rally支持测试不同版本的Elasticsearch,用户可以轻松地比较不同版本之间的性能差异。
丰富的报告:Rally生成详细的测试报告,包括测试结果、性能指标、图表等,帮助用户全面了解测试的结果。
可扩展性:Rally具有良好的可扩展性,用户可以编写自定义的测试插件,以满足特定的测试需求。
社区支持:Rally是一个开源项目,拥有活跃的社区支持,用户可以在GitHub上提交问题、提出建议,并参与到项目的开发和改进中来。
参考文档仓库地址:
官方文档:
安装esrally安装条件+
+
+
安装过程"17.0.10"2024-01-16LTSOpenJDKRuntimeEnvironment(Red_)(+7-LTS)OpenJDK64-BitServerVM(Red_)(+7-LTS,mixedmode,sharing)[root@es-repo~]添加javahome环境变量[root@es-repo~]source/etc/profile[root@es-repo~]安装esrally[root@es-repo~]________/__\_____///___//_//__`///////_,_//_/////_///_/|_|\__,_/_/_/\__,//____/Availabletracks:NameDescriptionDocumentsCompressedSizeUncompressedSizeDefaultChallengeAllChallenges--------------------------------------------------------------------------------------------------------------------------------------------------------------------------------------------------------------------------------------------------------------------------------------------------------------------------------------------------------------------------------------------------------------------------------------------------------------------------------------------------------------cohere_vectorBenchmarkforvectorsearchwithCohereWikipediadata32,893,221186.9_vectorBenchmarkfordensevectorindexingandsearch10,000,0007.2/apmElasticAPMbenchmarkforRally19,557N//pointpointtrack00bytes0bytesdefaultdefaultelastic/logsTrackforsimulatingloggingworkloads16,469,078N/AN/Alogging-indexingcross-clusters-search-and-replication,cross-clusters-search-and-snapshot,logging-disk-usage,logging-indexing-querying,logging-indexing,logging-querying-concurrent-stress,logging-querying,logging-snapshot-mount,logging-snapshot-restore,logging-snapshot,many-shards-quantitative,many-shards-snapshotselastic/securityTrackforsimulatingElasticSecurityworkloads77,513,777N/AN/Asecurity-queryinggenerate-alerts-source-events,security-indexing-querying,security-indexing,security-queryingelser-ingest-speedtestBenchmarkweightedtermsqueriesonELSERtokensontheMSMARCOpassagedataset1,050,000N/,ELSER-V2-PlatformSpecific,ELSER-V2,ELSER-Min-Latency-Multi-Doc-Multi-Parametric-Ingest,ELSER-Size-Search-Multi-Doc-Multi-Parametric-Ingest,ELSER-Multi-Doc-Multi-Parametric-Ingest,ELSER-Multi-Parametric-IngesteqlEQLbenchmarksbasedongameindexofSIEMdemocluster60,782,2114.5,index-sortinggeonamesPOIsfromGeonames11,396,503252.9,app-no-conflicts-index-only,app-fast-with-conflicts,significant-textgeopointPointcoordinatesfromPlanetOSM60,844,404482.1,app-no-conflicts-index-only,app-fast-with-conflictsgeopointshapePointcoordinatesfromPlanetOSMindexedasgeoshapes60,844,404470.8,app-no-conflicts-index-only,app-fast-with-conflictsgeoshapeShapesfromPlanetOSM84,220,56717.0,app-no-conflicts-bighttp_logsHTTPserverlogdata247,249,0961.2,runtime-fields,app-no-conflicts-index-only,app-sorted-no-conflicts,app-index-only-with-ingest-pipeline,update,app-no-conflicts-index-reindex-onlyk8s_metricsIndexrefreshbenchmarkswithaKubernetespodmetricsdataset8,642,0162.1licts-metrics-index-with-refresh,app-no-conflicts-metrics-index-with-intermittent-refresh,app-no-conflicts-metrics-index-only,app-no-conflicts-metrics-with-fast-refresh,fast-refresh-index-only,fast-refresh-index-with-searchmetricbeatMetricbeatdata1,079,60087.7gBenchmarkbm25,semanticandhybridsearchontheMSMARCOpassagedataset8,841,82316.3rflowQAstoredasnesteddocs11,203,029663.3,index-onlynoaaGlobaldailyweathermeasurementsfromNOAA33,659,481949.4,app-no-conflicts-index-only,aggs,filter-aggsnyc_taxisTaxiridesinNewYorkin2015165,346,7084.5,app-no-conflicts-index-only,app-sorted-no-conflicts-index-only,update,update-only,app-ml,aggs,esql,update-aggs-only,autoscale,autoscale-v2openai_vectorBenchmarkforvectorsearchusingtheOpenAItext-embedding-ada-002model2,680,96131.0kbasedonAOLqueries2,000,000121.1thacademicpapersfromPMC574,1995.5,app-no-conflicts-index-only,app-sorted-no-conflicts,app-fast-with-conflicts,indexing-queryingrandom_vectorBenchmarkingfilteredsearchonrandomvectors00bytes0bytesindex-and-searchindex-and-searchsoIndexingbenchmarkusinguptoquestionsandanswersfromStackOverflow36,062,2788.9,transform,frequent-itemsso_vectorBenchmarkforvectorsearchwithStackOverflowdata2,000,00012.3nNOAAWeatherdata33,659,481949.4,633,698N/,downsampletsdb_k8s_queriesmetricbeatinformationforelastic-appk8scluster17,280,000N/,app-no-conflicts,app-no-conflicts-index-only,esqlwikipediaBenchmarkforsearchwithWikipediadata22,986,18517.9----[INFO]SUCCESS(took60seconds)--------------------------------
可以看到esrally为我们内置了多种使用场景下的测试数据集,我们只需要按实际使用场景选择其中一种数据集进行测试即可。
使用esrally在线快速测试esrally可以在没有ES实列的情况下,去基于某一个指定版本的ES进行性能测试。
它的工作流程是:esrally会先去elastic官网下载对应的版本存在esrally目录里。下载完ES版本后,再去下载针对ES产品的性能测试数据。数据下载到本地后,再进行性能分析,最后将结果打印到控制台。
我们以目前最新的8.12.2版本为例,指定数据集为geopoint,测试类型为高速追加与并发索引操作场景下性能测试。
[root@es-repo~]su-esrally[esrally@es-repo~]$esrallyrace--distribution-version=8.12.2--track=geopoint--challenge=app-fast-with-conflicts________/__\_____///___//_//__`///////_,_//_/////_///_/|_|\__,_/_/_/\__,//____/[INFO]Raceidis[069938ff-b7c5-476a-966c-e5f96c2be780][INFO]Preparingforrace[INFO](592.4MBtotalsize)[100.0%][INFO]Downloadingtrackdata(482.1MBtotalsize)[100.0%][INFO]Decompressingtrackdatafrom[/home/esrally/.rally/benchmarks/data/geopoint/]to[/home/esrally/.rally/benchmarks/data/geopoint/](resultingsize:[2.28]GB)[OK][INFO]Preparingfileoffsettablefor[/home/esrally/.rally/benchmarks/data/geopoint/][OK][INFO]Racingontrack[geopoint],challenge[app-fast-with-conflicts]andcar['defaults']withversion[8.12.2].Runningdelete-index[100%done]Runningcreate-index[100%done]Runningcheck-cluster-health[100%done]Runningindex-update[100%done]Runningrefresh-after-index[100%done]Runningforce-merge[100%done]Runningrefresh-after-force-merge[100%done]Runningwait-until-merges-finish[100%done]------------------------------------------------------______________/____(_)________///___/_________________//_//__\/__`//\__\/___/__\/___/_\/__///////_///___///__//_////__//_//_/_//_/\__,_/_//____/\___/\____/_/\___/------------------------------------------------------|Metric|Task|Value|Unit||---------------------------------------------------------------:|-------------:|----------------:|-------:||Cumulativeindexingtimeofprimaryshards||51.1839|min||Mincumulativeindexingtimeacrossprimaryshards||8.50077|min||Mediancumulativeindexingtimeacrossprimaryshards||8.53849|min||Maxcumulativeindexingtimeacrossprimaryshards||8.5551|min||Cumulativeindexingthrottletimeofprimaryshards||0|min||Mincumulativeindexingthrottletimeacrossprimaryshards||0|min||Mediancumulativeindexingthrottletimeacrossprimaryshards||0|min||Maxcumulativeindexingthrottletimeacrossprimaryshards||0|min||Cumulativemergetimeofprimaryshards||17.3986|min||Cumulativemergecountofprimaryshards||119|||Mincumulativemergetimeacrossprimaryshards||2.46218|min||Mediancumulativemergetimeacrossprimaryshards||2.69797|min||Maxcumulativemergetimeacrossprimaryshards||4.05352|min||Cumulativemergethrottletimeofprimaryshards||0.429533|min||Mincumulativemergethrottletimeacrossprimaryshards||0.0546667|min||Mediancumulativemergethrottletimeacrossprimaryshards||0.0624083|min||Maxcumulativemergethrottletimeacrossprimaryshards||0.121967|min||Cumulativerefreshtimeofprimaryshards||9.8296|min||Cumulativerefreshcountofprimaryshards||560|||Mincumulativerefreshtimeacrossprimaryshards||1.51657|min||Mediancumulativerefreshtimeacrossprimaryshards||1.64044|min||Maxcumulativerefreshtimeacrossprimaryshards||1.74402|min||Cumulativeflushtimeofprimaryshards||0.688033|min||Cumulativeflushcountofprimaryshards||24|||Mincumulativeflushtimeacrossprimaryshards||0.0333333|min||Mediancumulativeflushtimeacrossprimaryshards||0.129933|min||Maxcumulativeflushtimeacrossprimaryshards||0.193933|min||TotalYoungGenGCtime||94.11|s||TotalYoungGenGCcount||2071|||TotalOldGenGCtime||0|s||TotalOldGenGCcount||0|||Storesize||2.59487|GB||Translogsize||3.07336e-07|GB||Heapusedforsegments||0|MB||Heapusedfordocvalues||0|MB||Heapusedforterms||0|MB||Heapusedfornorms||0|MB||Heapusedforpoints||0|MB||Heapusedforstoredfields||0|MB||Segmentcount||100|||TotalIngestPipelinecount||0|||TotalIngestPipelinetime||0|s||TotalIngestPipelinefailed||0|||MinThroughput|index-update|22891.2|docs/s||MeanThroughput|index-update|46390.4|docs/s||MedianThroughput|index-update|48999.4|docs/s||MaxThroughput|index-update|50301|docs/s||50thpercentilelatency|index-update|654.643|ms||90thpercentilelatency|index-update|985.375|ms||99thpercentilelatency|index-update|2593.74|ms||99.9thpercentilelatency|index-update|4959.35|ms||99.99thpercentilelatency|index-update|6490.22|ms||100thpercentilelatency|index-update|6621.38|ms||50thpercentileservicetime|index-update|654.643|ms||90thpercentileservicetime|index-update|985.375|ms||99thpercentileservicetime|index-update|2593.74|ms||99.9thpercentileservicetime|index-update|4959.35|ms||99.99thpercentileservicetime|index-update|6490.22|ms||100thpercentileservicetime|index-update|6621.38|ms||errorrate|index-update|0|%|----------------------------------[INFO]SUCCESS(took1400seconds)----------------------------------
Mediancumulativeindexingtimeacrossprimaryshards
主分片中索引文档所花费的最小、最大和中位数时间。
Cumulativemergetimeofprimaryshards
主分片合并时间总和:主分片在测试期间进行合并操作所花费的总时间。
MedianThroughput
中位数吞吐量:在测试期间,每秒处理的中位数请求量。
MaxThroughput
最大值吞吐量:在测试期间,每秒处理的最大值请求量。
99thpercentilelatency
99th百分位数延迟:在所有的请求中,有99%的请求的响应时间都小于或等于该值,只有1%的请求的响应时间超过该值
99thpercentileservicetime
99th百分位数服务时间:有99%的请求的服务时间(即服务器实际处理请求的时间)都小于或等于该值,只有1%的请求的服务时间超过该值。这个指标更专注于服务器处理请求的实际时间,包括请求在服务器端的处理、查询执行、文档检索等
离线外部集群性能测试在线测试便于我们快速了解指定版本的ES性能参数,但实际使用过程中,我们通常都是离线下载测试数据集,然后指定已有的ES集群进行性能测试。
curl-O[root@es-test~]./[root@es-test~]拉取rally镜像[root@es-test~]cd/root/.rally/benchmarks/tracks/default/geonames[root@es-testgeonames][root@es-test~]dockerrun-v/root/.rally:/rally/.rallyelastic/rally:2.10.0race\--offline--track-path=/rally/.rally/benchmarks/tracks/default/geonames\--pipeline=benchmark-only\--target-hosts=""\--client-options="use_ssl:true,verify_certs:false,basic_auth_user:'elastic',basic_auth_password:'NAtPtHVns1LcO4NUTg41'"\--report-format=csv\--report-file=/rally/
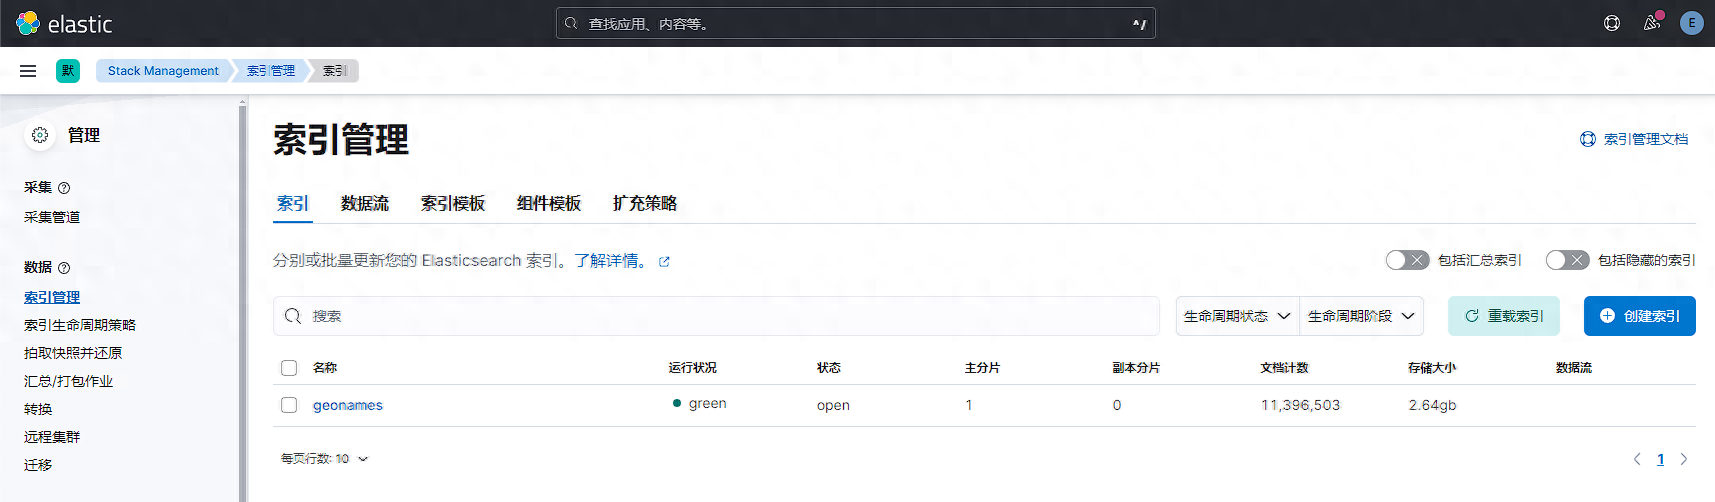
接下来查看kibana索引信息,已创建指定分片和副本的测试数据。
我们分别使用3套完全相同配置的3台机器组成es集群,所有集群设置相同的索引参数。分别测试es不同版本,不同部署方式下es性能差异具体为多少。
集群名
es版本
部署方式
配置信息
操作系统与内核版本
es-cluster1/3节点
8.12.2
rpm
4C8G50G(SSD)
/4.18.0
es-cluster2/3节点
8.12.2
docker
4C8G50G(SSD)
/4.18.0
es-cluster3/3节点
7.17.18
rpm
4C8G50G(SSD)
/4.18.0
测试结果由于测试结果项较多,此处不详细展示,测试结果文件已上传至网盘,有需要的可自行下载查看。
ES压测结果.xlsx
挑选几个重要指标进行对比,结果如下:
指标
最大索引吞吐量(docs/s)
40671.03
51065.85
44341.6
term查询最大延迟(ms)
35.901875
18.676184
22.832434
scroll查询最大延迟(ms)
700.778035
310.298231
406.003485
排序查询最大延迟(ms)
18.52360867
9.996094999
11.29074433
聚合查询最大延迟(ms)
246.29214
217.2186607
230.9802593
以性能指标为基准来看,和性能提升值如下:
最大索引吞吐量(docs/s):
:((51065.85-40671.03)/40671.03)*100%≈25.59%
:((44341.6-40671.03)/40671.03)*100%≈9.05%
term查询最大延迟(ms):
:((18.676184-35.901875)/35.901875)*100%≈-47.97%
:((22.832434-35.901875)/35.901875)*100%≈-36.40%
scroll查询最大延迟(ms):
:((310.298231-700.778035)/700.778035)*100%≈-55.69%
:((406.003485-700.778035)/700.778035)*100%≈-42.00%
排序查询最大延迟(ms):
:((9.996094999-18.52360867)/18.52360867)*100%≈-45.97%
:((11.29074433-18.52360867)/18.52360867)*100%≈-38.99%
聚合查询最大延迟(ms):
:((217.2186607-246.29214)/246.29214)*100%≈-11.79%
:((230.9802593-246.29214)/246.29214)*100%≈-6.24%
测试结论通过压测可知在k8s部署的es服务无论在写入还是读取数据时,性能都低于rpm方式运行的es。
rpm方式部署的es8相较于es7,写入性能提升16%,读取性能提升5-13%。
因此在部署es集群时,优先选择rpm方式部署es8版本集群,当集群规模更大时,为减轻运维工作,再考虑迁移至k8s容器运行es集群。
参考文档离线数据下载
命令行参数
查看更多微信公众号博客网站崔亮的博客-专注devops自动化运维,传播优秀it运维技术文章。更多原创运维开发相关文章,欢迎访问


")
